
Revenue per visitor gives your business an understanding of the value of their products that drive growth by providing insight into the traffic they receive.
However, this metric isn’t always reliable for analysis.
For example, high traffic may have low conversion rates that can decrease RPV.
However, this does not necessarily indicate that something is wrong since traffic doesn’t always translate to immediate sales. Conversely, even low traffic can still generate a good amount of sales.
RPV centers on the value of traffic which may not always be reliable but is best used along with other metrics to see validate its results.
What is Revenue per Visitor?
Definition of Revenue Per Visit
Revenue per Visitor (RPV) is a metric used to measure the average amount of revenue generated per visitor to a website or app.
RPV is a useful metric for businesses that rely on website or app traffic to generate revenue. Tracking RPV over time can help you identify trends and make adjustments to their marketing and sales strategies to optimize revenue generation.
Additionally, RPV can vary widely depending on factors such as the industry, the product or service being sold, and the quality of the website or app.
Revenue per Visitor Formula
It is calculated by dividing the total revenue generated by the number of visitors to the website or app during a given period.
For example, if a website generated $10,000 in revenue over the course of a month and had 10,000 visitors during that same time period, the RPV would be $1 ($10,000 / 10,000 visitors).
Formula using Conversion Rate and Average Order Value
To calculate Revenue Per Visitor (RPV), you must consider both conversion rate and average order value (AOV) to understand what is and isn’t working for overall sales.
Although conversion rate and AOV may appear different and distinct, they are closely related. Conversion rate measures the number of sales, while AOV indicates the dollar value behind each sale. Both are crucial in understanding a business’s total revenue.
RPV is a composite metric that combines conversion rate and AOV to create a single value, bridging the gap between the two eCommerce metrics.
RPV can be calculated by multiplying the conversion rate by AOV:
RPV = Conversion rate x AOV
Revenue per visitor is a useful metric to evaluate conversion efforts and determine which strategies are successful. A positive RPV signifies that marketing efforts are heading in the right direction, while a decrease in RPV may indicate unqualified traffic or issues in the customer journey.
There are various factors that could affect RPV, such as competitor ads on the website that redirect visitors to competitor sites, coupon extension abuse, cart abandonment problems, or website performance issues.
Revenue per Visitor benchmark by Industry
The revenue per visitor (RPV) benchmark can vary significantly depending on the industry. Here are some rough RPV benchmarks for a few different industries:
| Industry | Average Order Value | Conversion Rate | Revenue per Visitor |
| Luxury & Jewelry | 182 | 1.21% | 2.20 |
| Home & Furniture | 139 | 6.30% | 8.76 |
| fashion, Accessories, and Apparel | 126 | 3.12% | 3.93 |
| Beauty & Personal Care | 112 | 4.09% | 4.58 |
| Multi-Brand Retail | 109 | 2.20% | 2.40 |
| Food & Beverage | 75 | 5.45% | 4.09 |
| Pet Care & Veterinary Services | 71 | 3.73% | 2.65 |
| Consumer Goods | 37 | 4.55% | 1.68 |
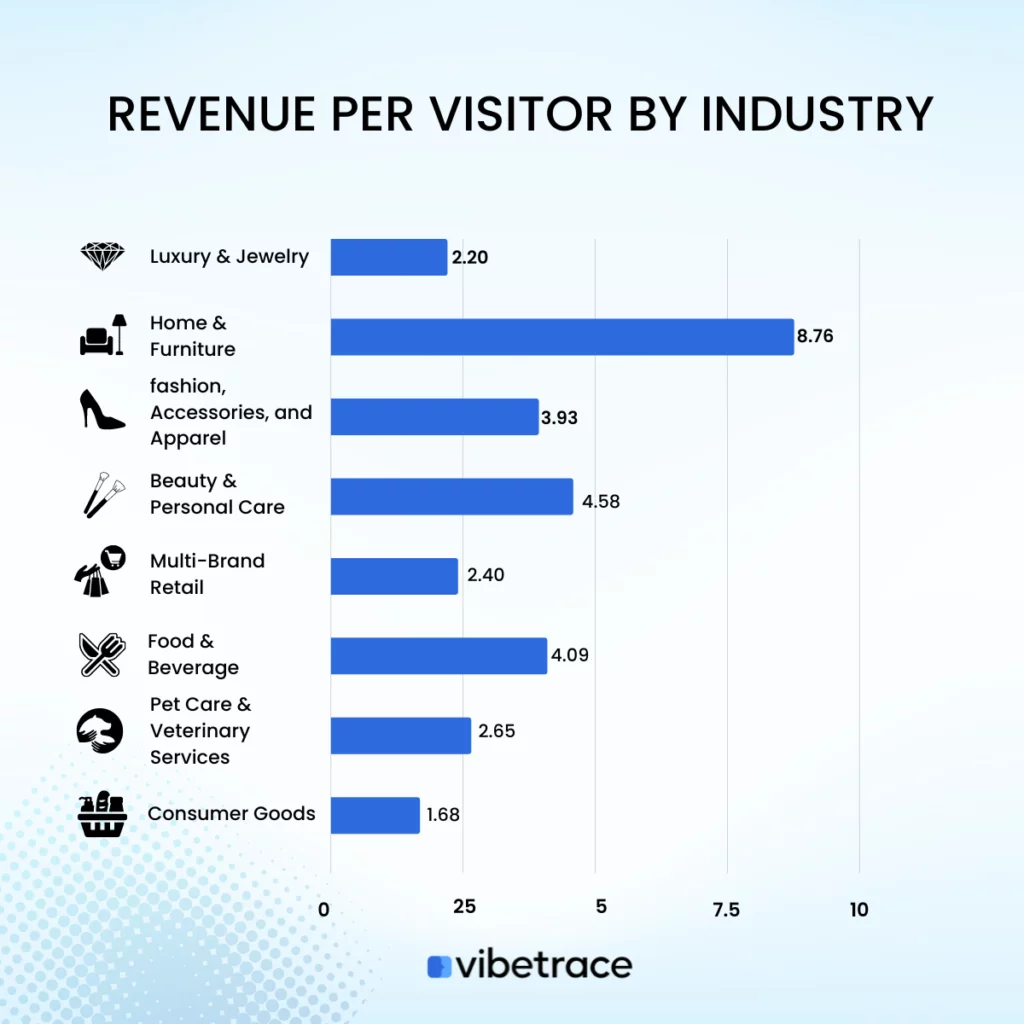
The data represents the average revenue generated per click or visit to various industries’ websites. The revenue per visitor is reported in dollars, and the data is categorized into different industries.
The industries listed in the data include Luxury & Jewelry, Home & Furniture, Fashion, Accessories, and Apparel, Beauty & Personal Care, Multi-Brand Retail, Food & Beverage, Pet Care & Veterinary Services, and Consumer Goods.
The Revenue per Visitor was calculated by multiplying the Conversion Rate and Average Order Value data by industry, as provided by Dividend Yield.
The highest revenue per visitor is observed in the Home & Furniture industry, with an average revenue of $8.76 per click. The lowest revenue per visitor is observed in the Consumer Goods industry, with an average revenue of $1.68 per click.
These figures could be useful for businesses and investors to understand the performance of different industries in terms of revenue generation per click or visitor to their websites.
How to track Revenue per Visitor?
There are various tools available that can help you track revenue per visitor. Here are a few options:
Google Analytics: Google Analytics is a free tool that can help you track the revenue generated by each visitor. You can set up e-commerce tracking in Google Analytics to track the revenue generated from each transaction, and then divide that revenue by the number of visitors to get the revenue per visitor.
Kissmetrics: Kissmetrics is a paid tool that can help you track revenue per visitor, as well as other metrics like user engagement and lifetime value. You can set up funnel tracking and cohort analysis in Kissmetrics to get a better understanding of how visitors are interacting with your site and how much revenue they are generating.
Mixpanel: Mixpanel is another paid tool that can help you track revenue per visitor. It offers a range of analytics and engagement tools, including funnel analysis, A/B testing, and cohort analysis.
Hotjar: Hotjar is a tool that can help you track visitor behavior on your site. While it doesn’t offer direct revenue tracking, you can use it to analyze visitor behavior and make changes to your site to increase revenue.
Ultimately, the tool you choose will depend on your specific needs and budget. Some tools may offer more advanced features, while others may be more affordable or easier to use.
How often should you check Revenue per Visitor?
The frequency of checking Revenue per Visitor (RPV) depends on several factors, such as the size of the business, the industry, and the level of website traffic. Generally, it is recommended to review RPV on a regular basis, such as weekly, biweekly, or monthly.
Weekly or Biweekly: For small businesses with lower traffic volume, monitoring RPV once a week or biweekly may be sufficient.
Daily or Weekly: For larger businesses with higher traffic volumes, it may be necessary to monitor RPV more frequently, such as on a daily or weekly basis.
Additionally, it’s essential to look at RPV within the context of other metrics to gain a more comprehensive understanding of how the business is performing. For instance, monitoring RPV alongside other key performance indicators (KPIs) such as conversion rate, bounce rate, and cart abandonment rate can help to identify trends and areas that require attention.
Revenue per Visitor Calculator
Do you want to calculate your revenue per visitor? Use our simple calculator below.
Simple Revenue per Visitor Calculator
Important Things about Revenue per Visitor
Here are some important things to know about Revenue per Visitor (RPV):
Measures the value of traffic that generate revenue: RPV is an important metric used to measure the effectiveness of a business’s website or online store in generating revenue. By dividing total revenue by the number of visitors, businesses can calculate the average amount of revenue generated per visitor.
Varies by industry: RPV can vary significantly depending on the industry, product or service offered, and target audience. It’s important to compare RPV to industry benchmarks and competitor performance to determine how well a business is performing in terms of revenue generation.
Limited to the revenue generated by visitors on website alone: While RPV can provide valuable insights into a business’s revenue generation potential, it doesn’t tell the whole story. Other metrics, such as conversion rates, customer lifetime value, and customer acquisition cost, should also be considered when evaluating a business’s revenue generation potential.
Requires a holistic approach: Improving RPV requires a holistic approach that involves optimizing various aspects of a business’s website or online store, such as website design, product offerings, pricing strategies, and marketing campaigns.
Changes in external factors affect RPV: RPV can be influenced by external factors such as seasonality, economic conditions, and changes in consumer behavior. Businesses should monitor these factors and adjust their strategies accordingly to optimize RPV.
Requires to be used alongside other metrics: RPV should be used in conjunction with other metrics to provide a more comprehensive picture of a business’s revenue generation potential. By analyzing RPV alongside other metrics, businesses can identify areas for improvement and develop strategies to optimize revenue generation.
Metrics related to Revenue per Visitor
There are several metrics that are related to revenue per visitor (RPV) and can be used to better understand the revenue generation potential of a website or online business. Here are a few:
Customer Acquisition Cost
The cost of acquiring a new customer, including marketing and sales expenses.
Customer Lifetime Value
The estimated total value of a customer to a business over the course of their lifetime
Average Order Value
Gross Margin
Indicates if the business is generating a high-profit margin on its products.
Vibetrace is a marketing automation platform that can help your business increase revenue per visitor by personalizing the customer experience and optimizing the customer journey.
Additionally, with marketing automation features offered by Vibetrace, you can easily target more customers visiting your website through email marketing.