
Have you checked the Latest Email Clients’ Statistics?
This article is part of our Marketing Statistics Topic.
Well, as statistics have proven, email remains a widely-used method of communication in both personal and professional settings, and it is expected to grow to over 347.03 billion emails being sent and received every single day in 2023.
Most people open their emails to start their days, and over the years there has been a shift towards mobile-apps email clients such as Apple, Gmail, and Outlook.
In fact, emails have been used in the marketing efforts of most businesses to reach and engage with customers in the last year more than ever.
Learn more about email clients’ statistics and trends as you go through this article.
What is an Email Client
An email client is a software application or web service that is commonly used to handle and organize email messages.
It can transmit, receive, and store messages, as well as organize and search existing conversations. It’s just the interface between user and software systems that handle everything related to email
Litmus has been reporting yearly an email client market share or ranks of email clients based on the number of users that utilize their platform.
This helps marketing of any business who uses emails to reach potential clients by providing data that can empower marketers to make accurate decisions for their marketing strategy, design, and email focus.

Why it’s important to know market share of email clients?
Email client used by your recipient is important to:
- adapt design to look good for each specific email client. This is important because otherwise emails are deleted, not clicked therefore revenue is lost
- Run statistics and find insights based on email clients.
Check out the most recent statistics here: https://www.litmus.com/email-client-market-share/
Post and pre-MPP launch: The market share information
The implementation of Apple’s Mail Privacy Protection (MPP) on September 20, 2021, affected Apple Mail users on iOS 15, iPadOS 15, and macOS Monterey devices.
It prevents marketers from obtaining accurate data on open rates, open times, geolocation, or device usage for users who choose to use it. Read more about why open rates are not so relevant any more.
This will affect the way the market share for Apple is analyzed.
The market information here includes Post- and pre-MPP launch:
Statistics of Email Clients Market Share Breakdown
(Post-Apple MPP launch)
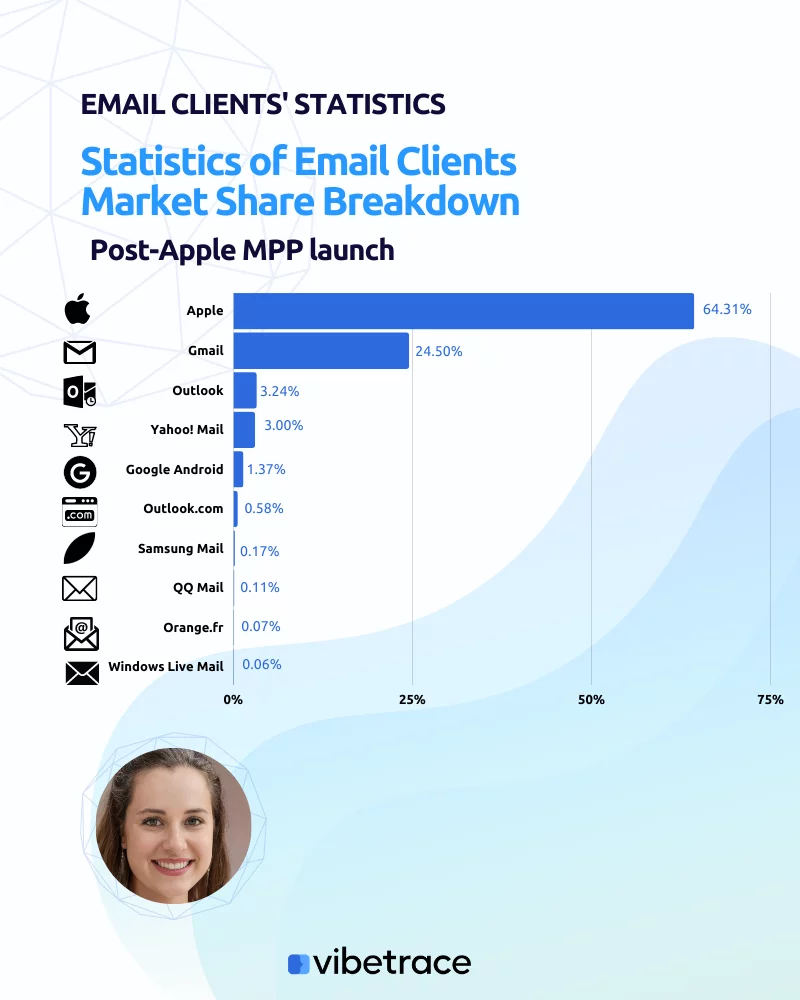
| Apple | 64.31% |
| Gmail | 24.50% |
| Outlook | 3.24% |
| Yahoo! Mail | 3.00% |
| Google Android | 1.37% |
| Outlook.com | 0.58% |
| Samsung Mail | 0.17% |
| QQ Mail | 0.11% |
| Orange.fr | 0.07% |
| Windows Live Mail | 0.06% |
The figures presented above provide a thorough analysis of each email client’s market shares as of December 2022.
According to the data, Apple’s email client is by far the most popular, accounting for 64.31% of the market.
This is more than double the market share of the second most widely used email client, Gmail, which has 24.50%.
Outlook, Yahoo! Mail, Google Android, Outlook.com, Samsung Mail, QQ Mail, Orange.fr, and Windows Live Mail all have market shares that vary from 3.24% to 0.06%.
These email clients account for a modest portion of the entire market, with Outlook ranking third with a 3.24% market share.
It’s also worth noting that Gmail is the only non-native email client with a significant market share, which might be attributed to Google’s ecosystem of goods and services.
The remaining email clients are device- or platform-specific, such as Samsung Mail for Samsung smartphones or Orange.fr for the French carrier Orange.
Overall, this data suggests that Apple and Gmail are the leading players in the email client market as of December 2022, while the other email clients have a relatively small presence.
(Pre-Apple MPP launch)
So what are the most used email clients?
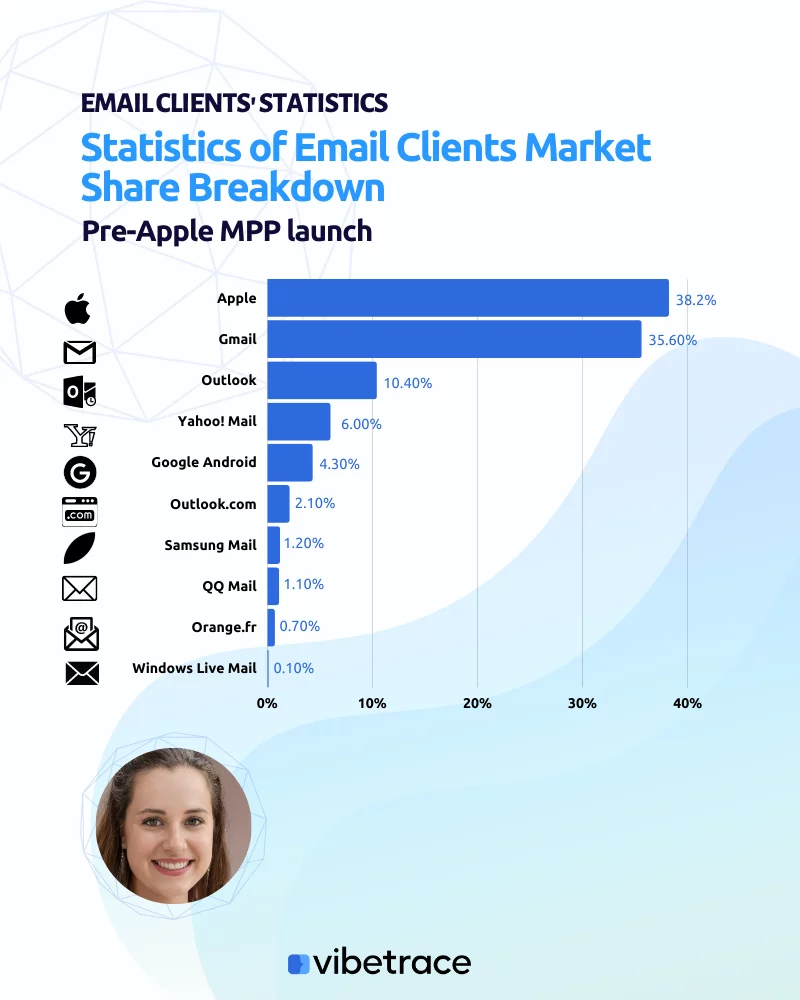
Breakdown of email clients popularity
| Apple | 38.20% |
| Gmail | 35.60% |
| Outlook | 10.40% |
| Yahoo! Mail | 6.00% |
| Google Android | 4.30% |
| Outlook.com | 2.10% |
| Samsung Mail | 1.20% |
| QQ Mail | 1.10% |
| Orange.fr | 0.70% |
| Windows Live Mail | 0.10% |
The statistics presented are based on pre-MPP data, which was gathered from more than 13 billion email opens in Litmus Email Analytics from August 2020 to August 2021.
Statistics of Email Performance Metrics by Industry
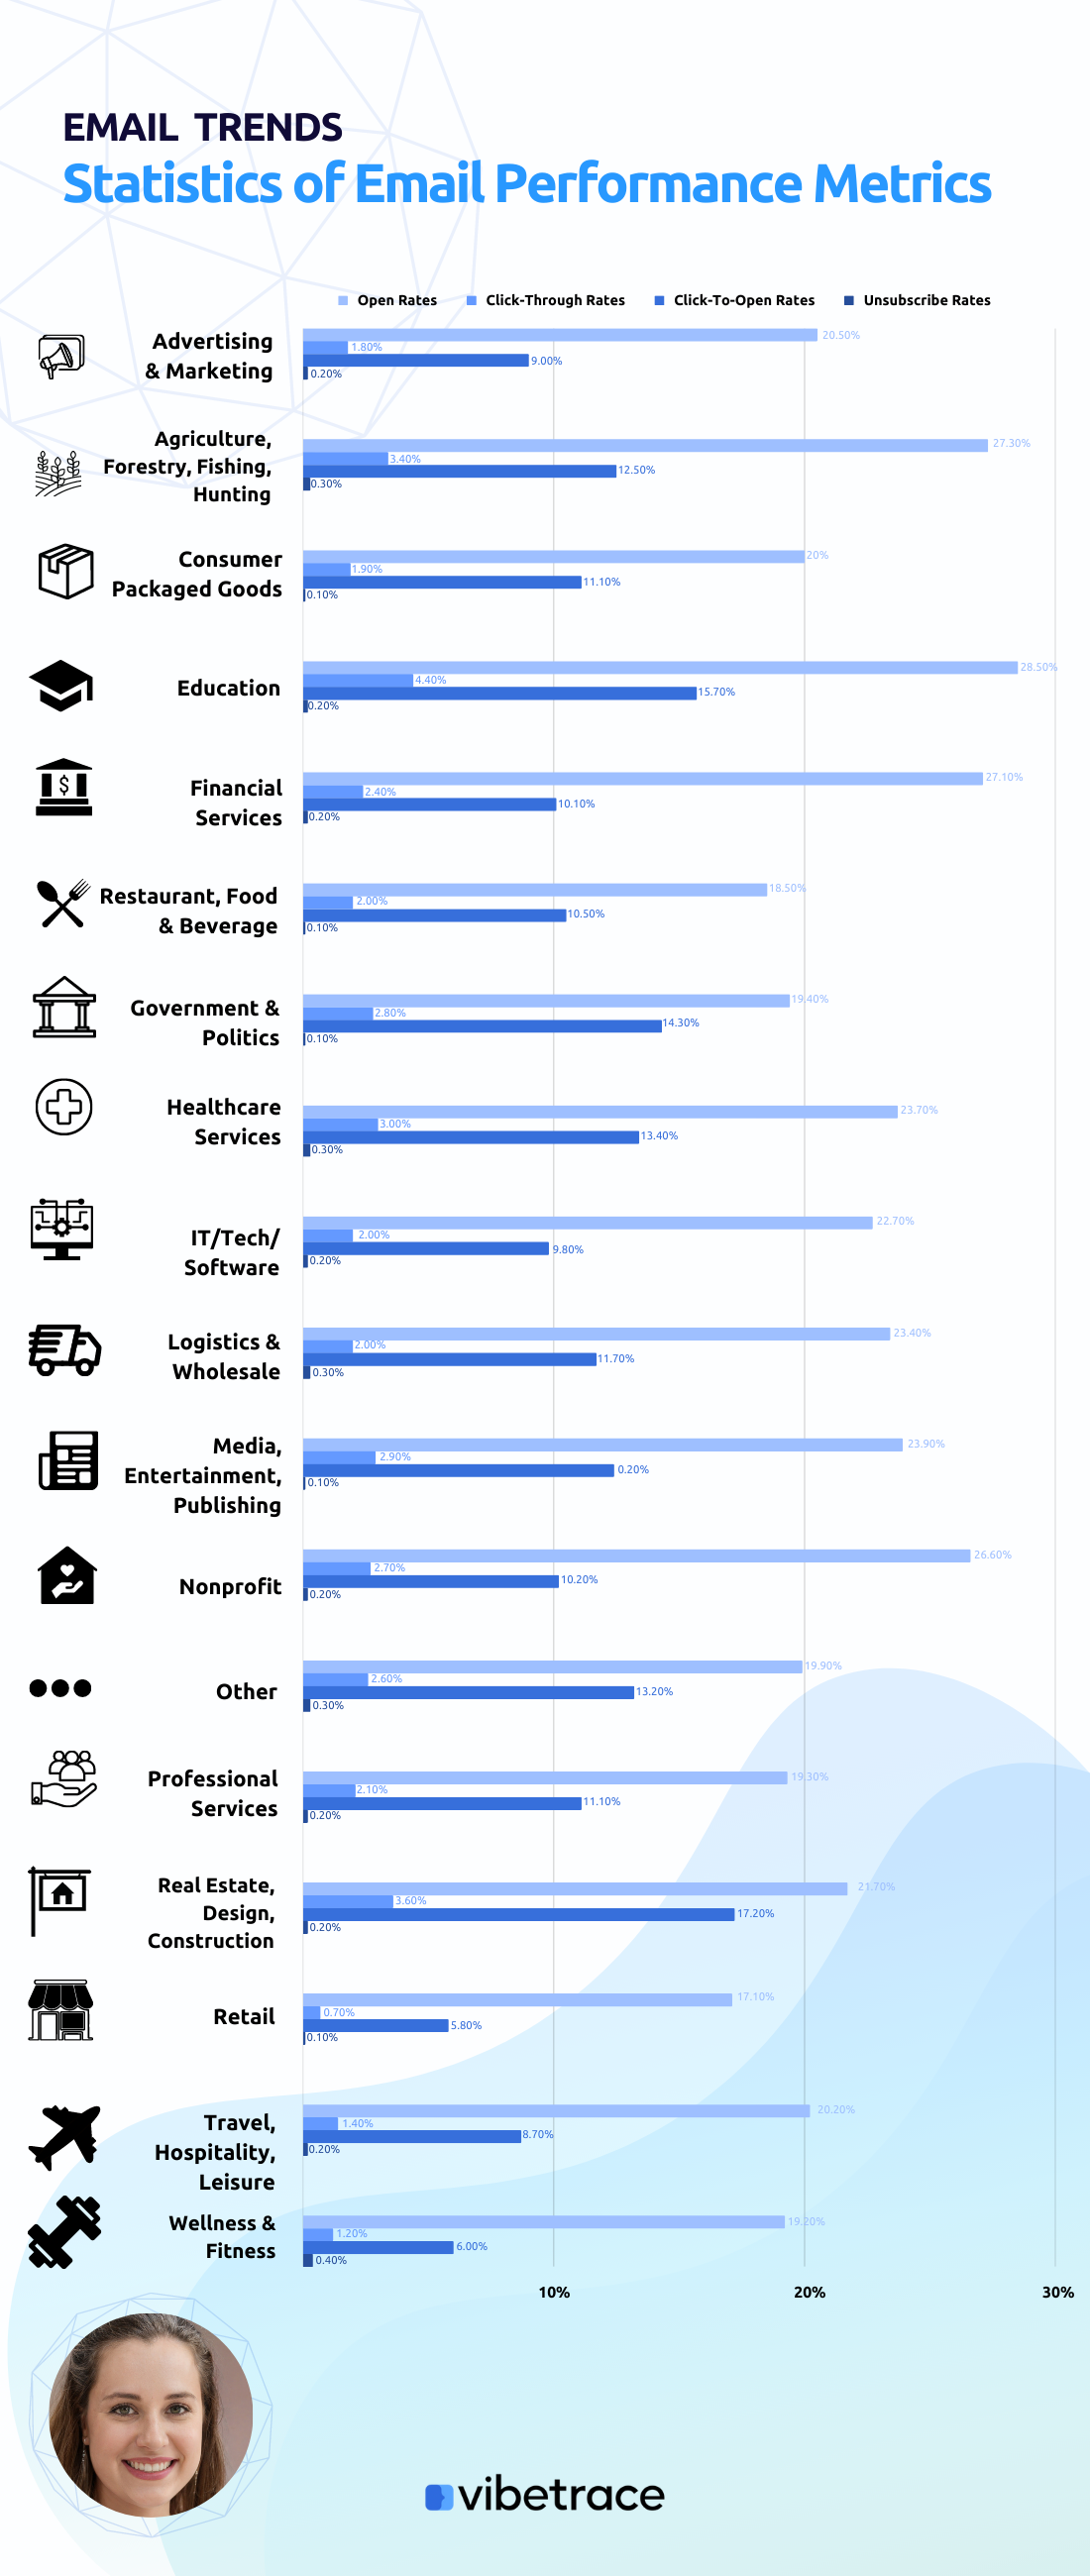
| Industry | Open Rates | Click-Through Rates | Click-To-Open Rates | Unsubscribe Rates |
| Advertising & Marketing | 20.50% | 1.80% | 9.00% | 0.20% |
| Agriculture, Forestry, Fishing, Hunting | 27.30% | 3.40% | 12.50% | 0.30% |
| Consumer Packaged Goods | 20% | 1.90% | 11.10% | 0.10% |
| Education | 28.50% | 4.40% | 15.70% | 0.20% |
| Financial Services | 27.10% | 2.40% | 10.10% | 0.20% |
| Restaurant, Food & Beverage | 18.50% | 2.00% | 10.50% | 0.10% |
| Government & Politics | 19.40% | 2.80% | 14.30% | 0.10% |
| Healthcare Services | 23.70% | 3.00% | 13.40% | 0.30% |
| IT/Tech/Software | 22.70% | 2.00% | 9.80% | 0.20% |
| Logistics & Wholesale | 23.40% | 2.00% | 11.70% | 0.30% |
| Media, Entertainment, Publishing | 23.90% | 2.90% | 12.40% | 0.10% |
| Nonprofit | 26.60% | 2.70% | 10.20% | 0.20% |
| Other | 19.90% | 2.60% | 13.20% | 0.30% |
| Professional Services | 19.30% | 2.10% | 11.10% | 0.20% |
| Real Estate, Design, Construction | 21.70% | 3.60% | 17.20% | 0.20% |
| Retail | 17.10% | 0.70% | 5.80% | 0.10% |
| Travel, Hospitality, Leisure | 20.20% | 1.40% | 8.70% | 0.20% |
| Wellness & Fitness | 19.20% | 1.20% | 6.00% | 0.40% |
| Averages Totals | 21.5% (+3.5%) | 2.3% (-0.3%) | 10.5% (-3.6%) | 0.1% (-) |
Open Rates
The data presented breaks down email open rates by industry. Read our article on Open Rate
Subject lines are really important for open rates.

According to the Campaign Monitor Data, open rates vary greatly among industries. Agriculture, Forestry, Fishing, and Hunting have the greatest open rate, with a 27.30% open rate.
Education is likewise one of the industries with a high open rate, with a 28.50% open rate.
Financial services, non-profit organizations, and healthcare services all have reasonably high open rates ranging from 27.10% to 23.70%.
Retail, on the other side, has the lowest open rate at 17.10%.
Restaurant, Food & Beverage, Government & Politics, IT/Tech/Software, Logistics & Wholesale, Media, Entertainment, Publishing, Professional Services, Real Estate, Design, Construction, Travel, Hospitality, Leisure, and Wellness & Fitness similarly have low open rates that range from 18.50% to 19.20%.
Advertising & Marketing and Consumer Packaged Goods sectors have similar open rates of 20.50% and 20% respectively.
The data also shows that the average open rate for all industries is 21.50%, with a +3.5% change from the previous period, suggesting a slight increase in overall open rates.
Do you like this article?
Join our CX for Retail dedicated newsletter!

Stay connected to what’s really important to optimize your digital revenues.
By clicking the button, you accept our Terms & Conditions. Also you will need to confirm your email address.
Click-Through Rates
The data provided breaks down click-through rates (CTR) by industry. CTR is a measure of how well an email campaign converts recipients into customers.

Education has the greatest click-through rate (4.40%), followed by Real Estate, Design, and Construction (3.60%). Agriculture, Forestry, Blessing, Hunting, Healthcare Services, and Government & Politics had similarly high click-through rates ranging from 3.40% to 2.80%.
Retail, on the other side, has the lowest click-through rate of 0.70%.
Restaurant, Food & Beverage, IT/Tech/Software, Logistics & Wholesale, Travel, Hospitality, Leisure, Wellness & Fitness, Advertising & Marketing, Consumer Packaged Goods, Financial Services, Media, Entertainment, Publishing, Nonprofit, Other, and Professional Services have low click-through rates ranging from 2.00% to 1.20%.
Click-through rates in the Advertising & Marketing and Consumer Packaged Goods sectors are similar, with 1.80% and 1.90%, respectively.
According to the statistics, the average click-through rate across all industries is 2.3%, a -0.3% decline from the previous quarter, indicating a modest decrease in overall click-through rates.
Click-To-Open Rates
The data presented breaks down click-to-open rates (CTOR) by industry.

CTOR calculates the ratio of unique clicks to unique opens to determine how well an email campaign converts users into customers. According to the research, click-to-open rates vary greatly between industries.
Real Estate, Design, and Construction have the greatest click-to-open rate (17.20%), followed by Education (15.70%). Agriculture, Forestry, Blessing, Hunting, Government & Politics, Healthcare Services, and Others had click-to-open rates ranging from 12.50% to 13.20%.
Wellness & Fitness, on the other side, has the lowest click-to-open rate of 6.00%. Retail, Travel, Hospitality, Leisure, Advertising & Marketing, Consumer Packaged Goods, Financial Services, Restaurant, Food & Beverage, IT/Tech/Software, Logistics & Wholesale, Media, Entertainment, Publishing, Nonprofit, and Professional Services all have low click-to-open rates that range from 5.80% to 11.10%.
The click-to-open rates for the Advertising & Marketing and Consumer Packaged Goods sectors are 9.00% and 11.10%, respectively.
The data also reveals that the average click-to-open rate across all industries is 10.5%, a -3.6% decrease from the previous quarter, indicating a drop in overall click-to-open rates.
Unsubscribe Rates
The statistics provided give a breakdown of unsubscribe rates by industry.

The unsubscribe rate measures the percentage of recipients who choose to unsubscribe or opt out of receiving future emails from a specific sender. The data shows that the unsubscribe rates vary slightly across different industries, but generally, they are low.
The industry with the highest unsubscribe rate is Wellness & Fitness with 0.40%, followed by Agriculture, Forestry, Fishing, Hunting and Healthcare Services with 0.30%. Logistics & Wholesale and Other also have relatively high unsubscribe rates of 0.30%.
Retail has the lowest unsubscribe rate with 0.10%.
Advertising & Marketing, Consumer Packaged Goods, Financial Services, Restaurant, Food & Beverage, Government & Politics, Media, Entertainment, Publishing, Nonprofit, Professional Services, Real Estate, Design, Construction, Travel, Hospitality, Leisure, and IT/Tech/Software also have relatively low unsubscribe rates, ranging from 0.10% to 0.20%.
The average unsubscribe rate for all industries is 0.1%, with no apparent change from the previous period, suggesting that unsubscribe rates are stable across different industries.
Summary
To summarize above statistics:
- Apple Mail is the dominant email client in 2023, Gmail is second
- Highest Open rates are in Education industry
- Highest Click rates are also in Education industry