
Revenue per Session identifies the health and performance of a business brand, summarizing the effectiveness of existing business strategies when it comes to its marketing.
In most cases, a common mistake in the e-commerce industry is not having a user-friendly website, making it quite difficult for users to find what they are looking for.
This reduces the ability of a website to attract more visitors due to improper optimization.
In order to get away with the same problem, it requires you to level up your strategies as well as your website interface.
To improve the effectiveness of your website and campaigns, keep track of your revenue per session. This metric is in a very close relation to revenue per visitor.
What is Revenue Per Session?
Definition of Revenue per session
Revenue per session (RPS) is a metric used in e-commerce and online businesses to measure the amount of revenue generated per user session on a website.
A user session is defined as the period of time during which a user interacts with a website or application. The RPS metric is calculated by dividing the total revenue generated by the number of user sessions.
RPS is a useful metric for your business because it allows them to measure the effectiveness of their marketing campaigns, pricing strategies, and user experience design.
What is a session?
A user session determines a sequence of user actions that are performed by the same user on a website during a limited period of time.
In Google Analytics, a session ends (times out) after 30 minutes of user inactivity. There is no limit to how long a session can last.
Revenue Per Session Formula
The formula for calculating Revenue per Session (RPS) is:
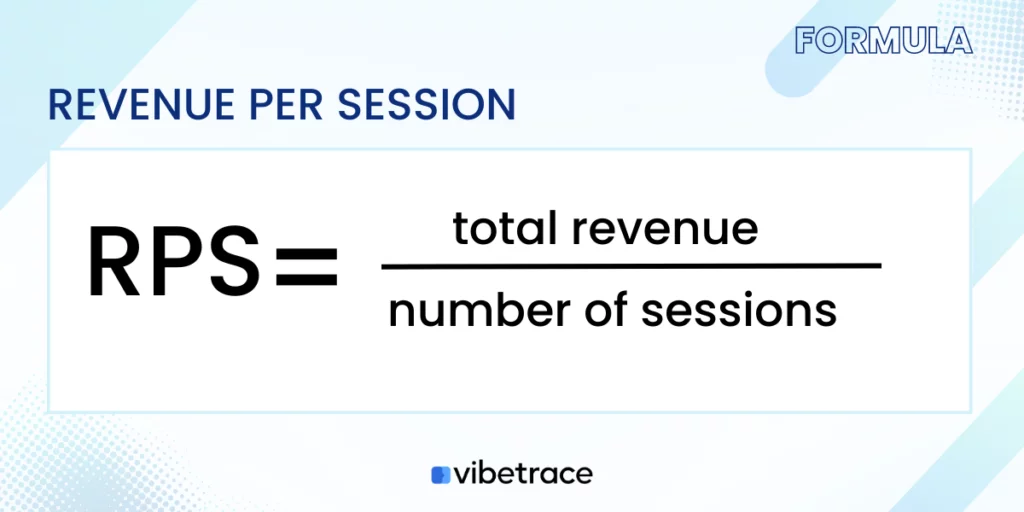
For example, if your website generates $10,000 in revenue over 1,000 user sessions in a week, your business RPS would be:
RPS = $10,000 / 1,000 = $10
Therefore, the Revenue per Session for that week is $10.
How to track Revenue Per Session?
Here are some general tools you can use to track Revenue Per Session (RPS):
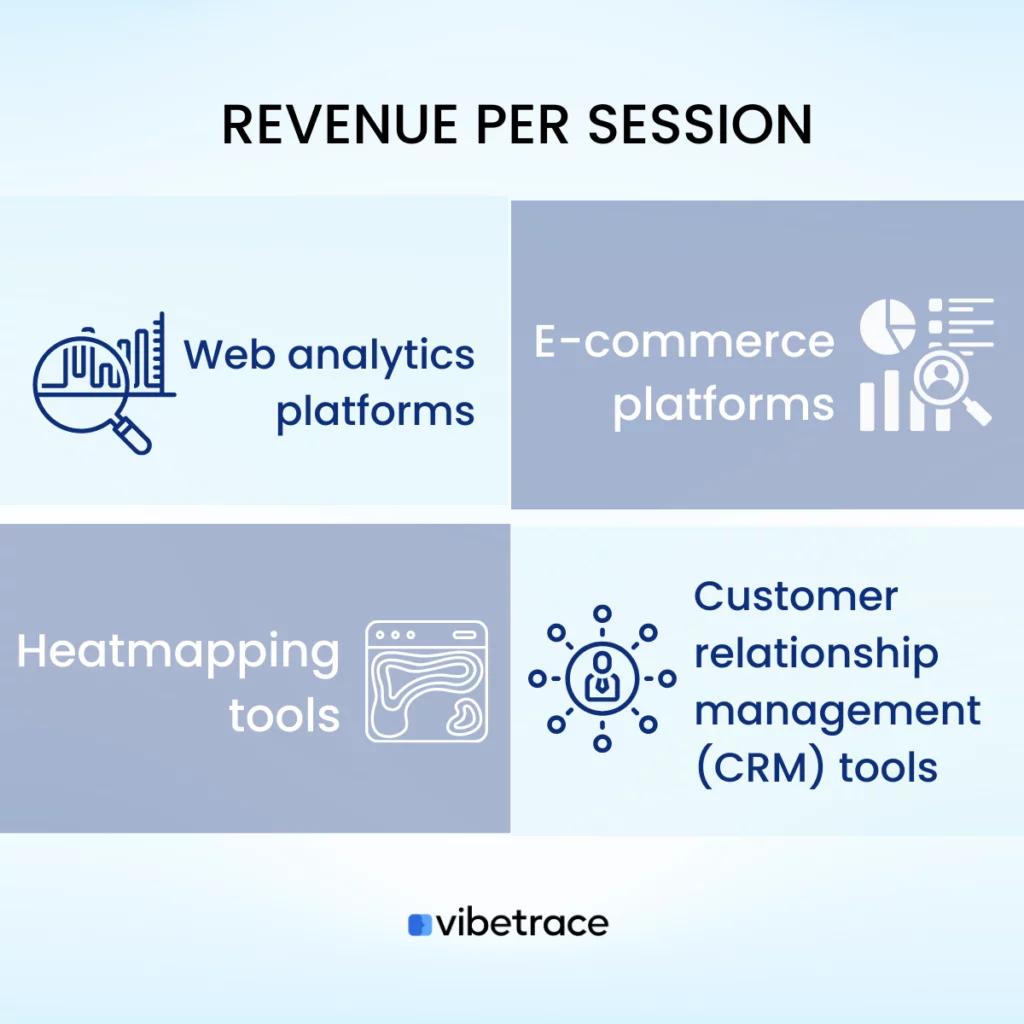
Web analytics platforms: Website traffic, user behavior, and income data can be tracked using tools such as Google Analytics, Adobe Analytics, and Piwik. You can utilize these platforms to create goals and track revenue, and then compute RPS using the “Sessions” statistic.
E-commerce platforms: Many e-commerce platforms, like Shopify, WooCommerce, and Magento, include analytics and reporting tools to help you track revenue and user behavior. Third-party integrations with analytics tools may also be available on these platforms to provide more insights.
Want to be up to date with Marketing?
Subscribe to our Retail CX newsletter!

Stay connected with what’s really important to optimize your digital revenues.
By clicking the button, you accept our Terms & Conditions. Also you will need to confirm your email address.
How often should you check Revenue Per Session?
The frequency with which you should check Revenue Per Session (RPS) depends on your business needs and goals. Generally speaking, it’s a good idea to track RPS regularly to monitor trends and identify opportunities for improvement.
You may track RPS on a daily basis to closely monitor revenue performance and make adjustments as needed.
On the other hand, you may also track RPS on a weekly or monthly basis to identify longer-term trends and make strategic decisions.
It’s crucial to remember that RPS is just one of several metrics that can help you understand the performance of your website or application.
Revenue Per Session Calculator
Do you want to calculate your revenue from repeat online customers? Use our simple calculator below.
Simple Revenue Per Session Calculator
Total Revenue:
Number of sessions:
Revenue Per Session
= ?
Important Things about Revenue Per Session
Here are some important things to keep in mind about Revenue Per Session (RPS):
Shows effectiveness of marketing efforts: You can determine which marketing campaigns are driving revenue and which are not by tracking RPS over time. This can assist you in better optimizing your marketing strategy and allocating resources.
Identify opportunities for improvement: If your RPS is lower than expected, it may indicate that there are opportunities to improve the user experience, pricing strategy, or product offerings of your website or application.
Influenced by a variety of factors: Factors such as traffic volume, user behavior, pricing, and seasonality can all have an impact on RPS. When analyzing RPS trends, it is critical to consider these factors.
Vary across different segments: RPS can differ between user segments, such as new users, returning users, and users from different geographic regions. To identify opportunities for optimization, it is essential to analyze RPS data by segment.
Impacted by external factors: External factors such as changes in the economy, industry trends, or competitors’ pricing strategies can all have an impact on RPS. It is crucial to keep an eye on these external factors and modify your strategy accordingly.
Metrics related to Revenue Per Session
Here are some metrics related to Revenue Per Session (RPS):
Revenue per Visitor
The amount of revenue generated by each visitor to the website.
Vibetrace is a marketing automation platform that can help you increase your revenue per session by providing personalized and relevant experiences to your customers.
Additionally, Vibetrace can help you optimize their marketing campaigns through A/B testing. By testing different messaging and offers, you can identify the most effective strategies for increasing your revenue per session.
Join the mailing list now and be updated of the current trends!